- Home
- About Us
- Blog
- Capabilities
Sub-Processes
Plastic Materials
Processes Available
Post Processing
- Contact Us
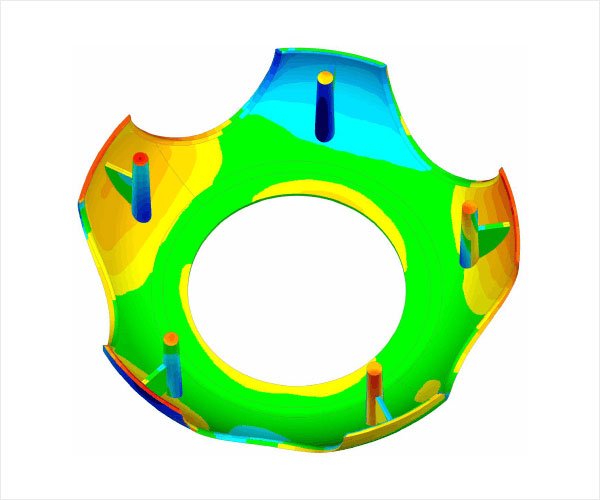
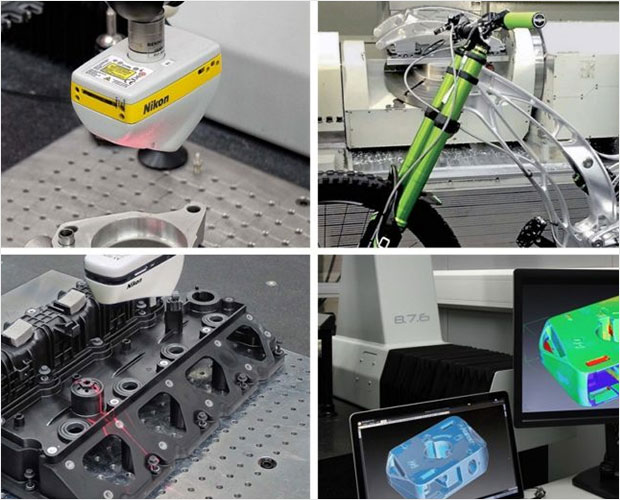
CMM measurement can’t meet all the requirements during the quality inspection process, sometimes graphical results are more intuitive and practical than text-based reports. Based on the scanned component, IPQC color mapping service can analyze the data and offer 3D color maps and reports that present the discrepancies and deviations between the scanned part and its nominal CAD model by comparing them. Color mapping technology allows you to easily view and analyze where problems may occur. It also shows depressions or protrusions that the CMM may miss. We primarily use Coordinate Measuring Machine and 3D laser scanner to collect key data of the part to be measured and use point cloud software to create the color maps. You can also use data from color mapping to modify CAD models to match actual parts, or for reverse engineering. The color mapping technology is a great solution to save time and improve the efficiency of your quality check and control.

Color mapping is a scalar visualization technique that is usually used for the color conversion of the final image and controls the color range of the image to display it correctly on the computer screen. The color mapping can be described as the algorithm that generates the mapping function or transforms the image colors. The operation object of color mapping is scalar attributes in the dataset. It is a common scalar algorithm. It will color each part according to the different scalar values of each part of the dataset. Color mapping is often used for calibrating the colors of two cameras for further processing with sample /images and adjusting the colors of two /images for perceptual visual compatibility.
